Advanced usage
This tutorial was written using a Jupyter Notebook.
Start by importing some stuff used by the Jupyter Notebook.
Examine the available rep to intensity mappings
The Program class has an input parameter called reps_to_intensity_func.
This can be set to whatever the user wishes (but warnings and errors might pop up if it is not a sufficiently `nice` function).
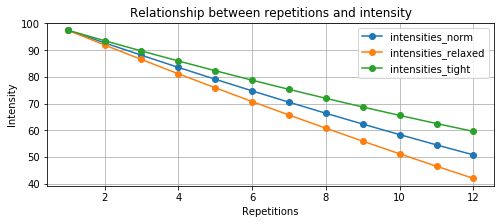
Let us look at the mapping between repetitions and intensity. Three mappings are available:
reps_to_intensity- The default map.reps_to_intensity_relaxed- A more `relaxed` mapping - many reps is not as heavy any more.reps_to_intensity_tight- A more `tight` mapping - many reps is heavier.
In [1]:
import matplotlib.pyplot as plt
from streprogen import reps_to_intensity, reps_to_intensity_relaxed, reps_to_intensity_tight

# Set up repetitions and apply all three mappings
reps = list(range(1, 12 + 1))
intensities_norm = list(map(reps_to_intensity, reps))
intensities_relaxed = list(map(reps_to_intensity_relaxed, reps))
intensities_tight = list(map(reps_to_intensity_tight, reps))
Plotting the rep to intensity mappings
In [2]:
plt.figure(figsize = (8, 3))
plt.title('Relationship between repetitions and intensity')
plt.plot(reps, intensities_norm, '-o', label = 'intensities_norm')
plt.plot(reps, intensities_relaxed, '-o', label = 'intensities_relaxed')
plt.plot(reps, intensities_tight, '-o', label = 'intensities_tight')
plt.ylabel('Intensity')
plt.xlabel('Repetitions')
plt.legend(loc = 'best')
plt.grid(True)
plt.show()
Plotting the rep to intensity mappings
In [3]:
table_width = 6
print('reps'.ljust(8),*[str(i).ljust(table_width) for i in reps])
print('-'*90)
print('norm'.ljust(8), *[str(round(i)).ljust(table_width) for i in intensities_norm])
print('relaxed'.ljust(8),*[str(round(i)).ljust(table_width) for i in intensities_relaxed])
print('tight'.ljust(8),*[str(round(i)).ljust(table_width) for i in intensities_tight])
reps     1      2      3      4      5      6      7      8      9      10     11     12
------------------------------------------------------------------------------------------
norm     98     93     88     84     79     75     70     66     62     58     54     51
relaxed  98     92     86     81     76     71     66     61     56     51     46     42
tight    98     94     90     86     82     79     75     72     69     66     62     60
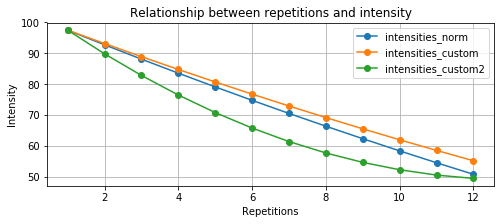
Creating a new rep to intensity mapping
In [4]:
from functools import partial

# Method 1: Using a partial function
custom_set_intensity = partial(reps_to_intensity, slope=-4.4, constant=97.5)
intensities_custom = list(map(custom_set_intensity, reps))

# Method 2: Custom function from scratch
def custom_set_intensity(reps):
    return 97.5 - 8 *(reps - 1) + 0.33*(reps - 1)**2

intensities_custom2 = list(map(custom_set_intensity, reps))
In [5]:
plt.figure(figsize = (8, 3))
plt.title('Relationship between repetitions and intensity')
plt.plot(reps, intensities_norm, '-o', label = 'intensities_norm')
plt.plot(reps, intensities_custom, '-o', label = 'intensities_custom')
plt.plot(reps, intensities_custom2, '-o', label = 'intensities_custom2')
plt.ylabel('Intensity')
plt.xlabel('Repetitions')
plt.legend(loc = 'best')
plt.grid(True)
plt.show()
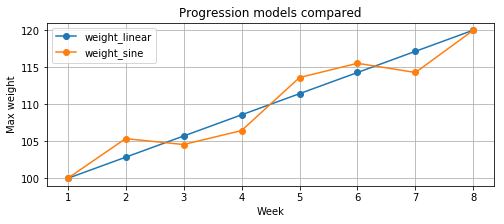
Examine the available progression models
The Program class has an input parameter called progress_func.
It defaults to progression_sinusoidal(), but progression_linear() is also available. Partial functions based off progression_sinusoidal() can be used, or the user can define their own function, but it must have a signature like progression_custom(week, start_weight, end_weight, start_week, end_week).
In [6]:
from streprogen import progression_linear, progression_sinusoidal

# Set up some constants
duration = 8
start, end = 100, 120

# Create lists
weeks = list(range(1, duration + 1))
weight_linear = [progression_linear(week, start, end, 1, duration) for week in weeks]
weight_sine = [progression_sinusoidal(week, start, end, 1, duration) for week in weeks]
A plot of the available progression models
In [7]:
plt.figure(figsize = (8, 3))
plt.title('Progression models compared')
plt.plot(weeks, weight_linear, '-o', label = 'weight_linear')
plt.plot(weeks, weight_sine, '-o', label = 'weight_sine')
plt.ylabel('Max weight')
plt.xlabel('Week')
plt.legend(loc = 'best')
plt.grid(True)
plt.show()
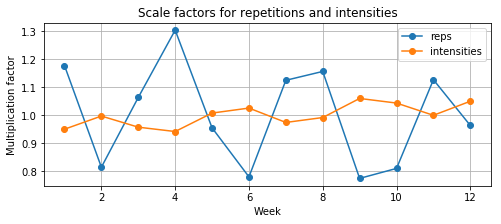
Scale reps and intensities
The Program class has input parameters rep_scalers and intensity_scalers. By default a RepellentGenerator is created and the RepellentGenerator().yield_from_domain() method is used to generate a list of factors to scale repetitions and itensities. The user can define their own list of factors too, as shown below using the progression_sinusoidal() function.
In [8]:
duration = 12

# A function to create scalers for the repetitions and itensity
reps      = partial(progression_sinusoidal, start_weight = 1.1,  end_weight = 0.9,  start_week = 1, end_week = duration, periods=3, scale=0.25, offset=2)
intensity = partial(progression_sinusoidal, start_weight = 0.95, end_weight = 1.05, start_week = 1, end_week = duration, periods=3, scale=0.04, offset=0)

# Create lists
weeks = list(range(1, duration + 1))
intensities = list(map(intensity, weeks))
reps = list(map(reps, weeks))
In [9]:
plt.figure(figsize = (8, 3))
plt.title('Scale factors for repetitions and intensities')
plt.plot(weeks, reps, 'o-', label = 'reps')
plt.plot(weeks, intensities, 'o-', label = 'intensities')
plt.ylabel('Multiplication factor')
plt.xlabel('Week')
plt.legend(loc = 'best')
plt.grid(True)
plt.show()